Publications
| 2017 |
Blending tools for a Smooth Introduction to 3D Geovisualization |
Laura Tateosian, Payam Tabrizian, IEEE Visualization - 2nd Pedagogy of Data Visualization Workshop |
| 2017 |
GazeGIS: A Gaze-based Reading
and Dynamic Geographic Information System. |
Tateosian, L., Glatz, M., Shukunobe, M., and Chopra, P. Visualization and Mathematics, Springer Berlin
Heidelberg. |
| 2016 |
Python for ArcGIS |
Tateosian; Springer Books, New York, NY. |
| 2014 |
GIS-Based Analysis of Coastal Lidar Time-Series |
Hardin, Mitasova, Tateosian, Overton; Springer Books |
| 2013 |
Visualizations of Coastal Terrain Time-series |
Tateosian, Mitasova, Thakur, Hardin, Russ, and Blundell; Information Visualization |
| 2013 |
Summary Visualizations for Coastal Spatial-Temporal Dynamics (extended paper) |
Thakur, Tateosian, Mitasova, Hardin, and Overton, M.; International Journal for Uncertainty Quantification |
| 2012 |
Who’s Watching Your Food? A Flexible Framework for Public Health Monitoring. |
Tateosian, L., Supak, S., Luo, H., Fang, K., Harrell, J., Harrelson, C., Bailey, A., and Devine; Transactions in GIS |
| 2011 |
Summary Visualizations for Coastal Spatial-Temporal Dynamics (short paper). |
Thakur, S., Tateosian, L. G., Hardin, E., Mitasova, H., and Overton, M. IEEE Working with Uncertainty
Workshop |
| 2010 |
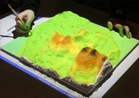
TanGeoMS: Tangible geospatial modeling system |
Tateosian, Mitasova, Harmon, Fogleman, Weaver, Harmon; TVCG |
| 2007 |
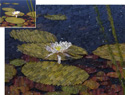
Engaging Viewers Through Nonphotorealistic Visualizations |
Tateosian, Healey, Enns; NPAR |
| 2006 |
Investigating Aesthetic Visualizations |
Tateosian; Ph.D. Dissertation |
| 2006 |
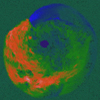
Stevens Dot Patterns for 2D Flow Visualization |
Tateosian, Dennis, Healey; APGV |
| 2005 |
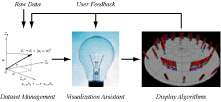
Designing a Visualization Framework for Multidimensional Data |
Dennis, Kocherlakota, Sawant, Tateosian, Healey; IEEE CG&A |
| 2004 |
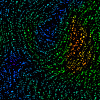
Perceptually-Based Brush Strokes for Nonphotorealistic Visualization |
Healey, Enns, Tateosian, Remple; ACM TOG |
| 2002 |
Nonphotorealistic Visualization of Multidimensional Datasets |
Tateosian; M.S. Thesis |
|
Posters
| 2017 |
Interactive Visualizations of Conflict Economies |
Amindarbari, R., Shukunobe, M., and Tateosian, L. |
| 2017 |
Py4All: Innovative feedback tool for students of geospatial programming |
Tateosian, L., Bader, S., Huckaby, B., Dunnagan, C., and Webster, J. |
| 2016 |
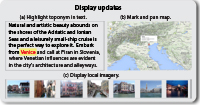
Representing Time on Story Telling Maps |
Tateosian, L., Glatz, M. and Shukunobe, M. |
| 2013 |
Visualizing Coastal Tourism and Landscape Change. |
Thakur, S., Tateosian, L., Mitasova, H. and Hardin, E. |
| 2011 |
Visualizing Coastal Spatial-Temporal Dynamics |
Tateosian, L. G., Thakur, S., Hardin, E., Mitasova, H., and Overton, M. |
| 2010 |
Exploring Topographic Change Impacts with a Tangible Geospatial Modeling System |
Weaver, di Leo, Mitasova, Tateosian; Binghamton Geomorphology Symposium |
| 2009 |
Multivariate Visualization of Continuous Datasets, a User Study |
Hagh-Shenas, Kim, Tateosian, Healey; IEEE InfoVis |
|
Reports
|